Apply Filters to the RxCheck Dashboard
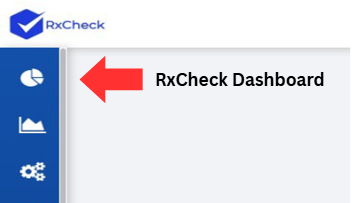
Click the pie graph icon on the left-hand side of the screen to access the RxCheck Dashboard.
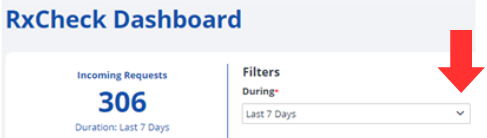
Click on the downward-facing arrow for the filter titled "During" to reveal options to filter by.
Select the period to match the historical timeframe you would like to populate the RxCheck dashboard.
Note: This filter is set to last 7 days by default.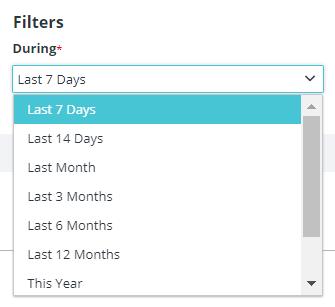
Click on the downward-facing arrow for the filter titled "Healthcare Entities (PDMP-Site Code)" to reveal a list of healthcare entities.
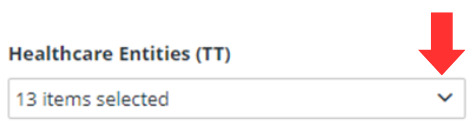
Select the desired healthcare entity(ies) by:
- Scrolling through the dropdown and checking the box next to each desired entity, or
- Typing in the Search Bar to filter the entities.
Note: By default, all options are selected. To clear your selections, click the checkbox next to the search bar before choosing your desired options.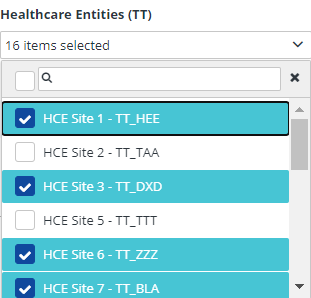
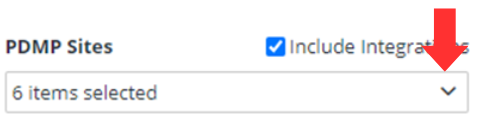
Click on the downward-facing arrow for the filter titled "PDMP Sites" to reveal a list of states.
Select the desired PDMP Site(s) by:
- Scrolling through the dropdown and checking the box next to each desired state, or
- Typing in the Search Bar to filter the states.
Note: By default, all options are selected. To clear your selections, click the checkbox next to the search bar before choosing your desired options.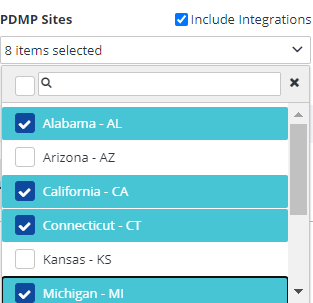
Uncheck the "Include Integrations" box to exclude transaction counts from out-of-state healthcare entities.
Note: This option is selected by default.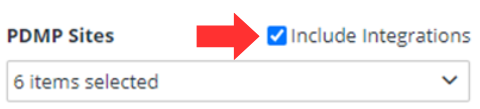
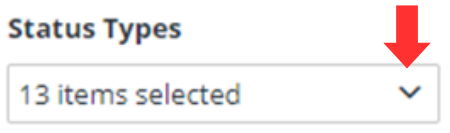
Click on the downward-facing arrow for the filter titled "Status Types" to reveal a list of status options.
Select the desired Status Type(s) by:
- Scrolling through the dropdown and checking the box next to each desired status, or
- Typing in the Search Bar to filter the status types.
Note: By default, all options are selected. To clear your selections, click the checkbox next to the search bar before choosing your desired options.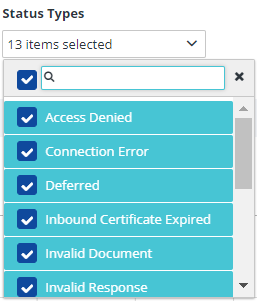
Click on the Apply Filter button to apply your selected filters on the dashboard.