
Current Site Monitoring
-
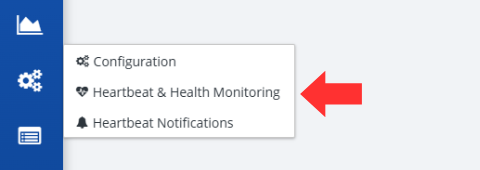
Click on the State Routing Service button, followed by the Heartbeat & Health Monitoring option, located on the left-hand side of the screen.
-
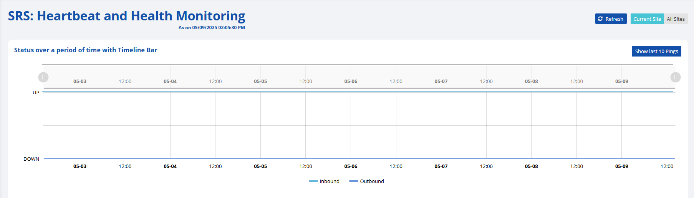
By default, you will be at the current site SRS: Heartbeat and Health Monitoring screen.
-
This screen includes various graphs to show the current status of the SRS.
Note: The table at the end of this section includes additional information regarding what is monitored in each graph. -
A user can click the Refresh button to get the most up to date information regarding their SRS.

-
A user can click the Show last 10 Pings button to view a table of the last 10 pings to the SRS.
Note: The headers in the table are described in the following table.
| Header | Description |
|---|---|
| DeviceID | An identification code that references the device that pinged the SRS. |
| Host | A reference code to identify the RxConsole state and version that pinged the SRS. |
| InstanceID | Identification of the instance of the SRS that was pinged. |
| IP# | The IP address of the instance of the SRS that was pinged. |
| Site Code | The two letter code that references the state. |
| Time Stamp | The date and time the ping occurred. |
| Graph Title | X-Axis | Y-Axis | Description |
|---|---|---|---|
| Status over a period of time with Timeline Bar | Time | Status—Up/Down | The status of the SRS over a period of time. |
| Instance Status | Time | Status—Up/Down | The status of the SRS over a period of time, allows you to use the dropdown to switch the instance. |
| JVM Threads | Time | Number of JVM Threads | Displays the number of active Java Virtual Machine (JVM) threads at regular time intervals. Rising lines may indicate increased load or usage and falling lines may suggest stable or reduced activity. |
| Garbage Collectors | Time | Time spent collecting and releasing the memory | Indicates how much time garbage collection took. Helps to identify memory issues which can impact application responsiveness. |
| CPU | Time | Percent usage | The amount of processing power used over time. |
| JVM Memory | Time | Size of JVM memory | Helps to detect trends such as memory growth, potential memory leaks, or inefficient memory usage patterns. |
| Disk Space Used | Time | Size of disk space | Helps identify storage trends, which may signal the need for a cleanup or capacity planning. |